01 Nov 5 Crazy-Effective Drone Mapping Software Tools (And How To Use Them)
When it comes down to it, the reason why construction companies are using drones on projects is for the data.
How does drone data improve a business though?
The most obvious benefit of using drones in construction is for speed. You get data more quickly with a drone than you would any other way. Because of this, you experience other benefits such as improving your bottom line, eliminating assumptions on a project, and speeding up cash flow.
However, in order to make these improvements in the most efficient manner, you have to be looking at different analytics and reports offered within your drone mapping software.
The goal of this post is to help you understand exactly what those analytics are, what they do, and why they’re important.
We used our own cloud-based solution, Site IQ, and the analytics we offer, to serve as an example of what to be looking out for in a drone software provider, especially if you’re enterprise.
Keep in mind there are other analytical items that didn’t make this list, but no worries, this post highlights all the important features that can make the biggest impact on your projects!
Here are the five different types of analytics and reports construction companies must get from drone mapping:
Understanding Present Day Topography with Drone Maps
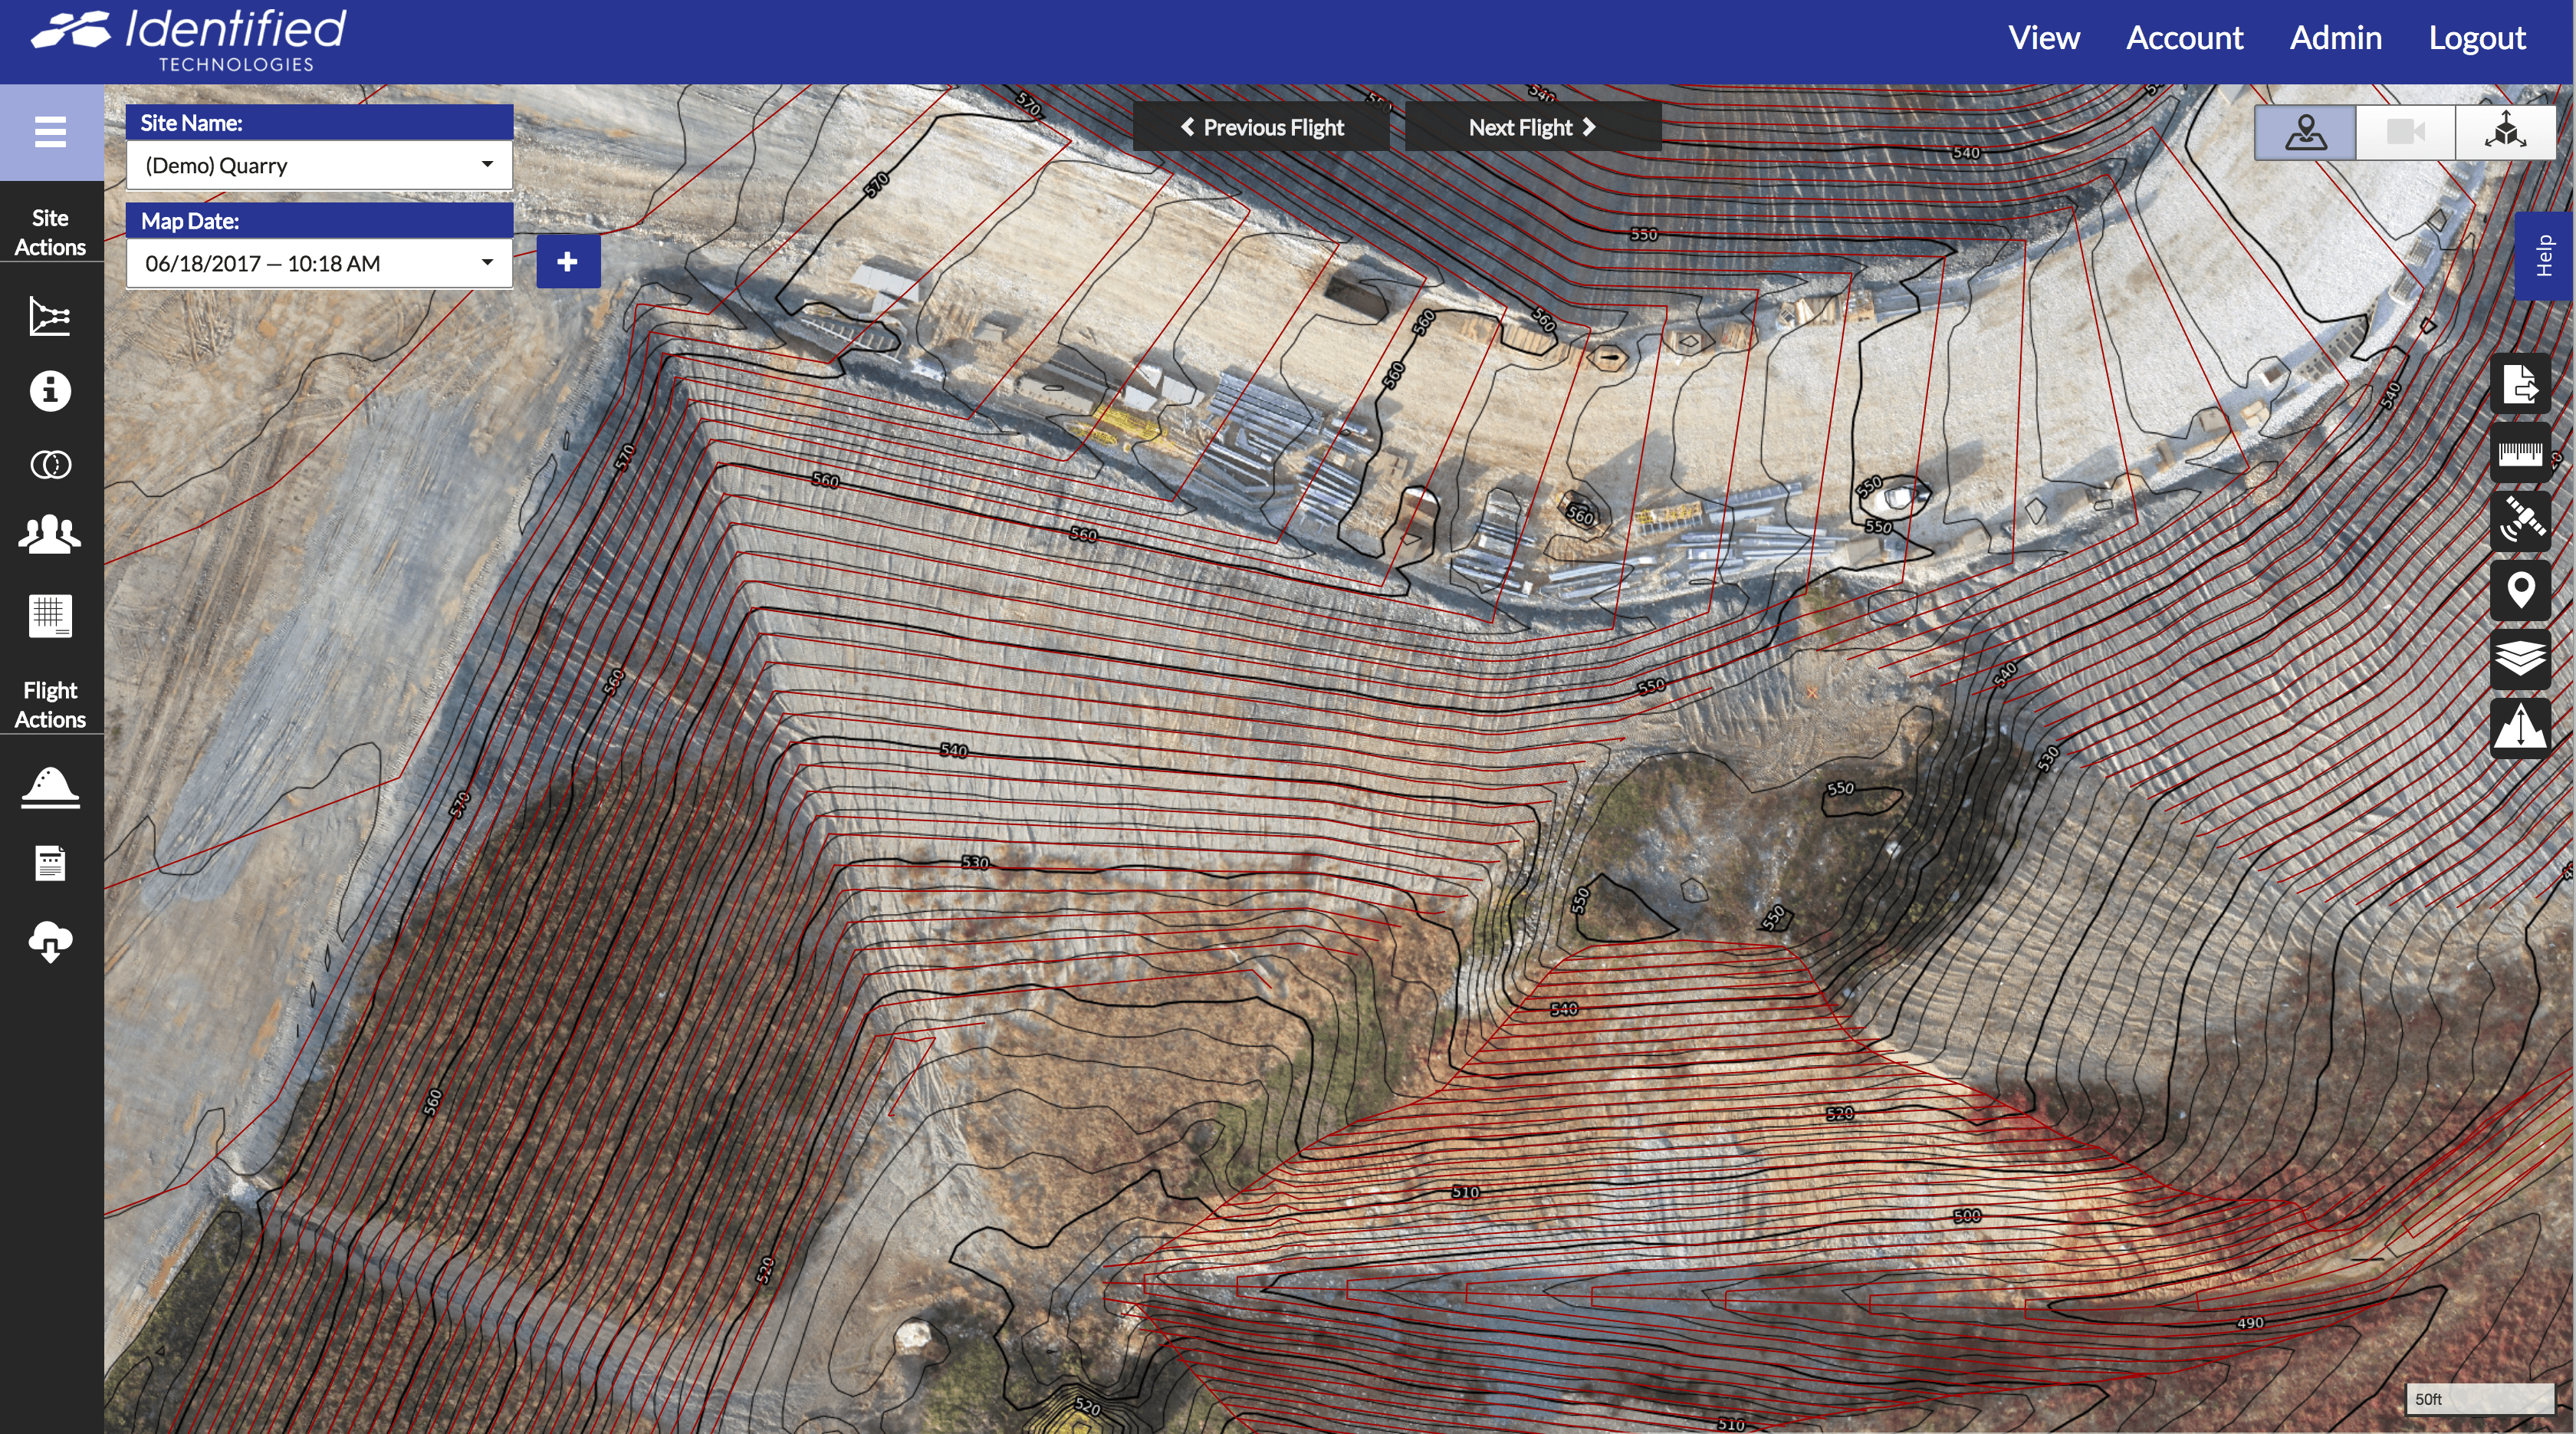
The drone map is the simplest thing you can view inside your drone software– it’s the visual image of the job site with the associated geospatial data. However, it serves as the base for several analytics and reports that allow you to make actionable decisions.
This map is compatible with computer-aided design (CAD) software so you’re able to confirm topography and compare older topographies/contour maps with the updated surface provided by the drone to see changes.
The ability to do this is crucial for accurate bidding.
Why is that?
Let’s say you’re bidding from a map that states the project is 100,000 cubic yards.
The map provided happens to be 10 years old, thus possibly inaccurate.
After looking at the drone map, you realize there is, in fact, an inaccuracy and your bid is off by 50,000 cubic yards. Thankfully, with this insight, you’re able to make revisions and bid the correct amount.
 *Click to enlarge*
In the Site IQ screenshot, you can see how there is a difference between the two contours. The old map data overlaid with the new map data allows you to see how the terrain has changed.
Winning Bids and Invoicing with Cut/Fill Quantities and Heat Maps
Data coming from tracking cut and fill is important for what is paid for the project, which goes hand and hand with bidding the correct amount.
With this, you’re understanding the total amount of material removed (cut) and hauled (fill) on the job site. The UAV software offers you these analytics easily, quickly, and accurately, which is important because payments are based on cut/fill cubic yards.
On Site IQ, this tool can generate a cut/fill quantities report. You can compare to where the project was last week/month, to the start of the project, and most commonly to a design file (the final product).
You can also use heat maps on Site IQ to see the quantities of earthworks visually on the map, from the current day of production on the job site to the final day, rather than just in a report.
Not only does this feature help with bidding, but also it helps with trust. You’re able to understand subcontractor work and confirm what they’ve done.
As you can see in the Site IQ screenshot, there is a highlighted blue area where there was cut work was done and the corresponding amount on the graph to the left.
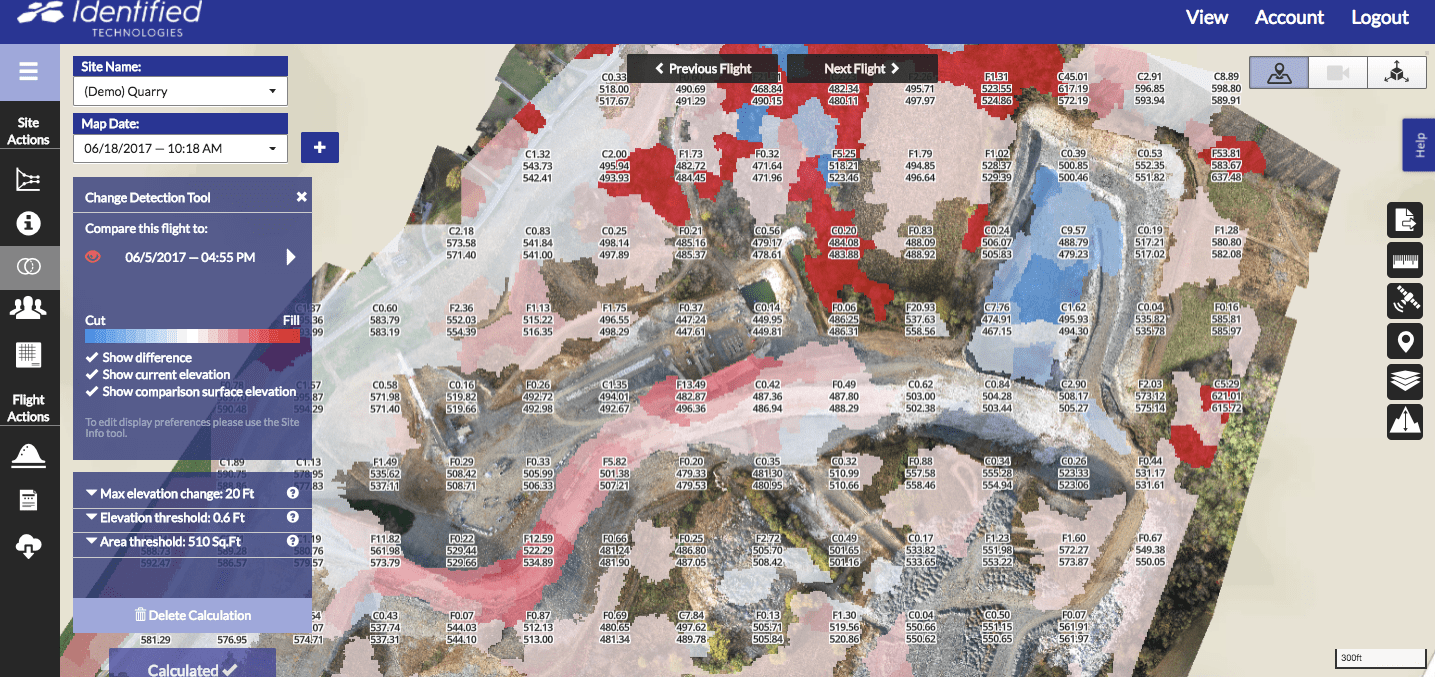
Comprehending Job Site Progress with Change Detection Technology
In construction, change is constantly occurring, so the concept of ‘detecting change’ is a necessity.
This tool is similar to tracking cut/fill, but highlights where the cut/fill changes are occurring, instead of focusing on the exact characteristics of those quantities.
Those changes are highlighted with blue (cut) and red (fill) overlay, on Site IQ, so you’re able to easily see where cut work was filled on the map and how much you have to go along the way. (You’re also able to switch the colors if you prefer the opposite).
Change detection technology is a very digestible way to see what your site looks like on a daily basis without actually having to be there. You’ll understand where excavation processes occurred, where dirt was moved, etc.
This insight you have into activity having a drone solution on the job site helps you stay on schedule during the span of the project.
 *Click to enlarge*
As you can see in the Site IQ screenshot, the drone map has red and blue overlays where the changes cut/fill changes have occurred.
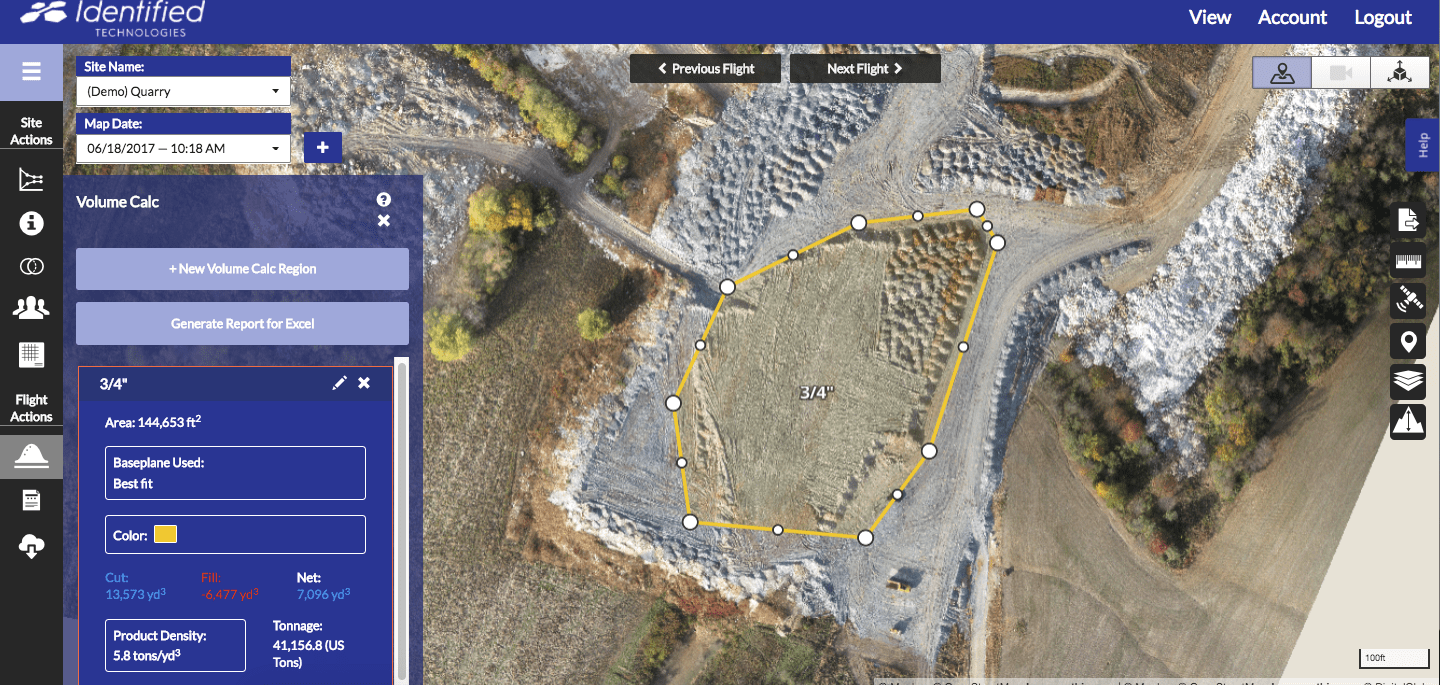
Billing Correctly with 3D Volume Calculations and Volume Report
Do you invoice based per yard of material moved? Or perhaps you have some inventory of construction materials sitting on your site you need to sell.
If so, consider 3D volume calculations as your best friend.
Similar to cut/fill analytics, 3D volume calculations give you analytics to material quantities on the job site.
What’s the difference?
On Site IQ, this tool reports deeper analytics into specific materials on site.
You can see the individual piles of material circled and outlined that accompany a corresponding report.
The volume report defines datasets like the density, volume, tonnage, and the dollar amount associated with the pile. So, if you get paid per yard or ton, it helps you bill the correct amount and speeds up your cash flow.
 *Click to enlarge*
In the Site IQ screenshot, you can see the selected area with all of the stats, including the tonnage, density, etc.
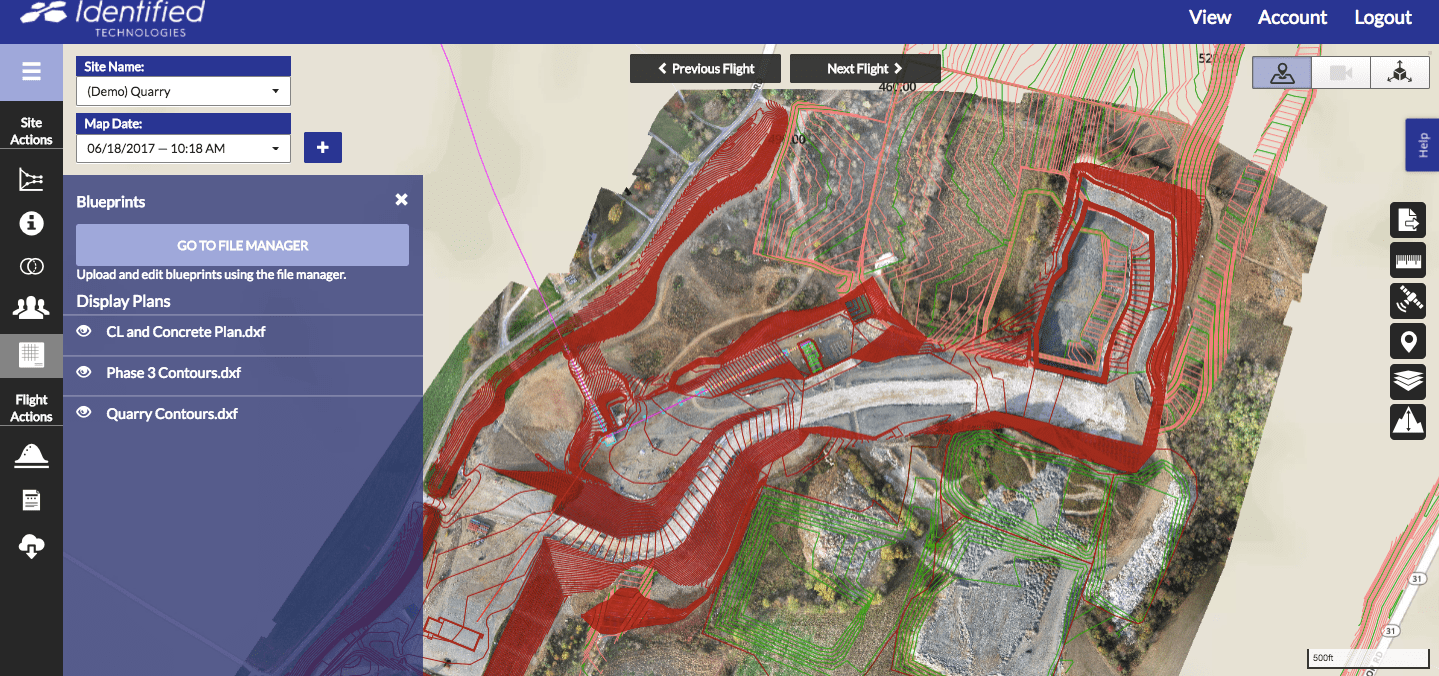
Keep Projects in Check with As Built v. As Planned Overlays
A tool like this is a must-have with your drone software, mainly so you know if things are ‘going according to plan’ while on a project.
With this, you’re to make sure what’s happening on your site in real-time is matching up with your original design plan. This gives you piece of mind and keeps operations running as planned.
Let’s break this down some more:
Picture yourself on a project, working with data that’s four weeks old that isn’t lining up with your design plan. This in itself is going to put you behind schedule.
When using our drone software, Site IQ, we call it ‘As Built v. As Planned Overlays,’ you’re able to implement this physically through the blueprints tool. Visually, you’ll see the design plan overlayed on top of what’s currently being constructed.
You’re then able to compare the two and keep everything in check.
 *Click to enlarge*
In the Site IQ screenshot, you can see the design plan (lighter red overlay) and the current progress (darker red overlay).
Analytics and Reports Crucial for Construction Projects
After taking a look at the different analytics, datasets, and reports you can receive from a drone mapping provider, it begs the question:
‘What’s the most vital tool/report for construction projects, specifically?”
For construction and earthmoving projects, having the ability to track changes with change detection technology and quantifying it with tracking cut and fill is critical.
Why does this matter?
It tells you exactly how much cut and fill you have to go from where you started on the project.
This information is vital, it’s your insider to progress and gives you the tools to understand if you’ll finish on time or not, in real-time. A drone mapping solution is the only way you’ll this information, this fast.
Conclusion
Have a better grip on the data you can get from drone mapping?
We hope you do now!
Understanding the specific drone analytics are the first steps to getting the job site answers you need for bidding, staying on schedule, speeding up cash flow, etc.
Consuming this data in a quick, efficient way while on a project is your key to success and what we are enabling with our cloud-based solution, Site IQ, and the survey drone.
Comment below and weigh in what you think is the most important dataset you can get from a drone mapping provider.
No Comments